Explore
×
-

PG Program in Data Science
8 Months · Online
In collaboration with

-

PG Data Science with Al
12 Months · Online
In collaboration with
-

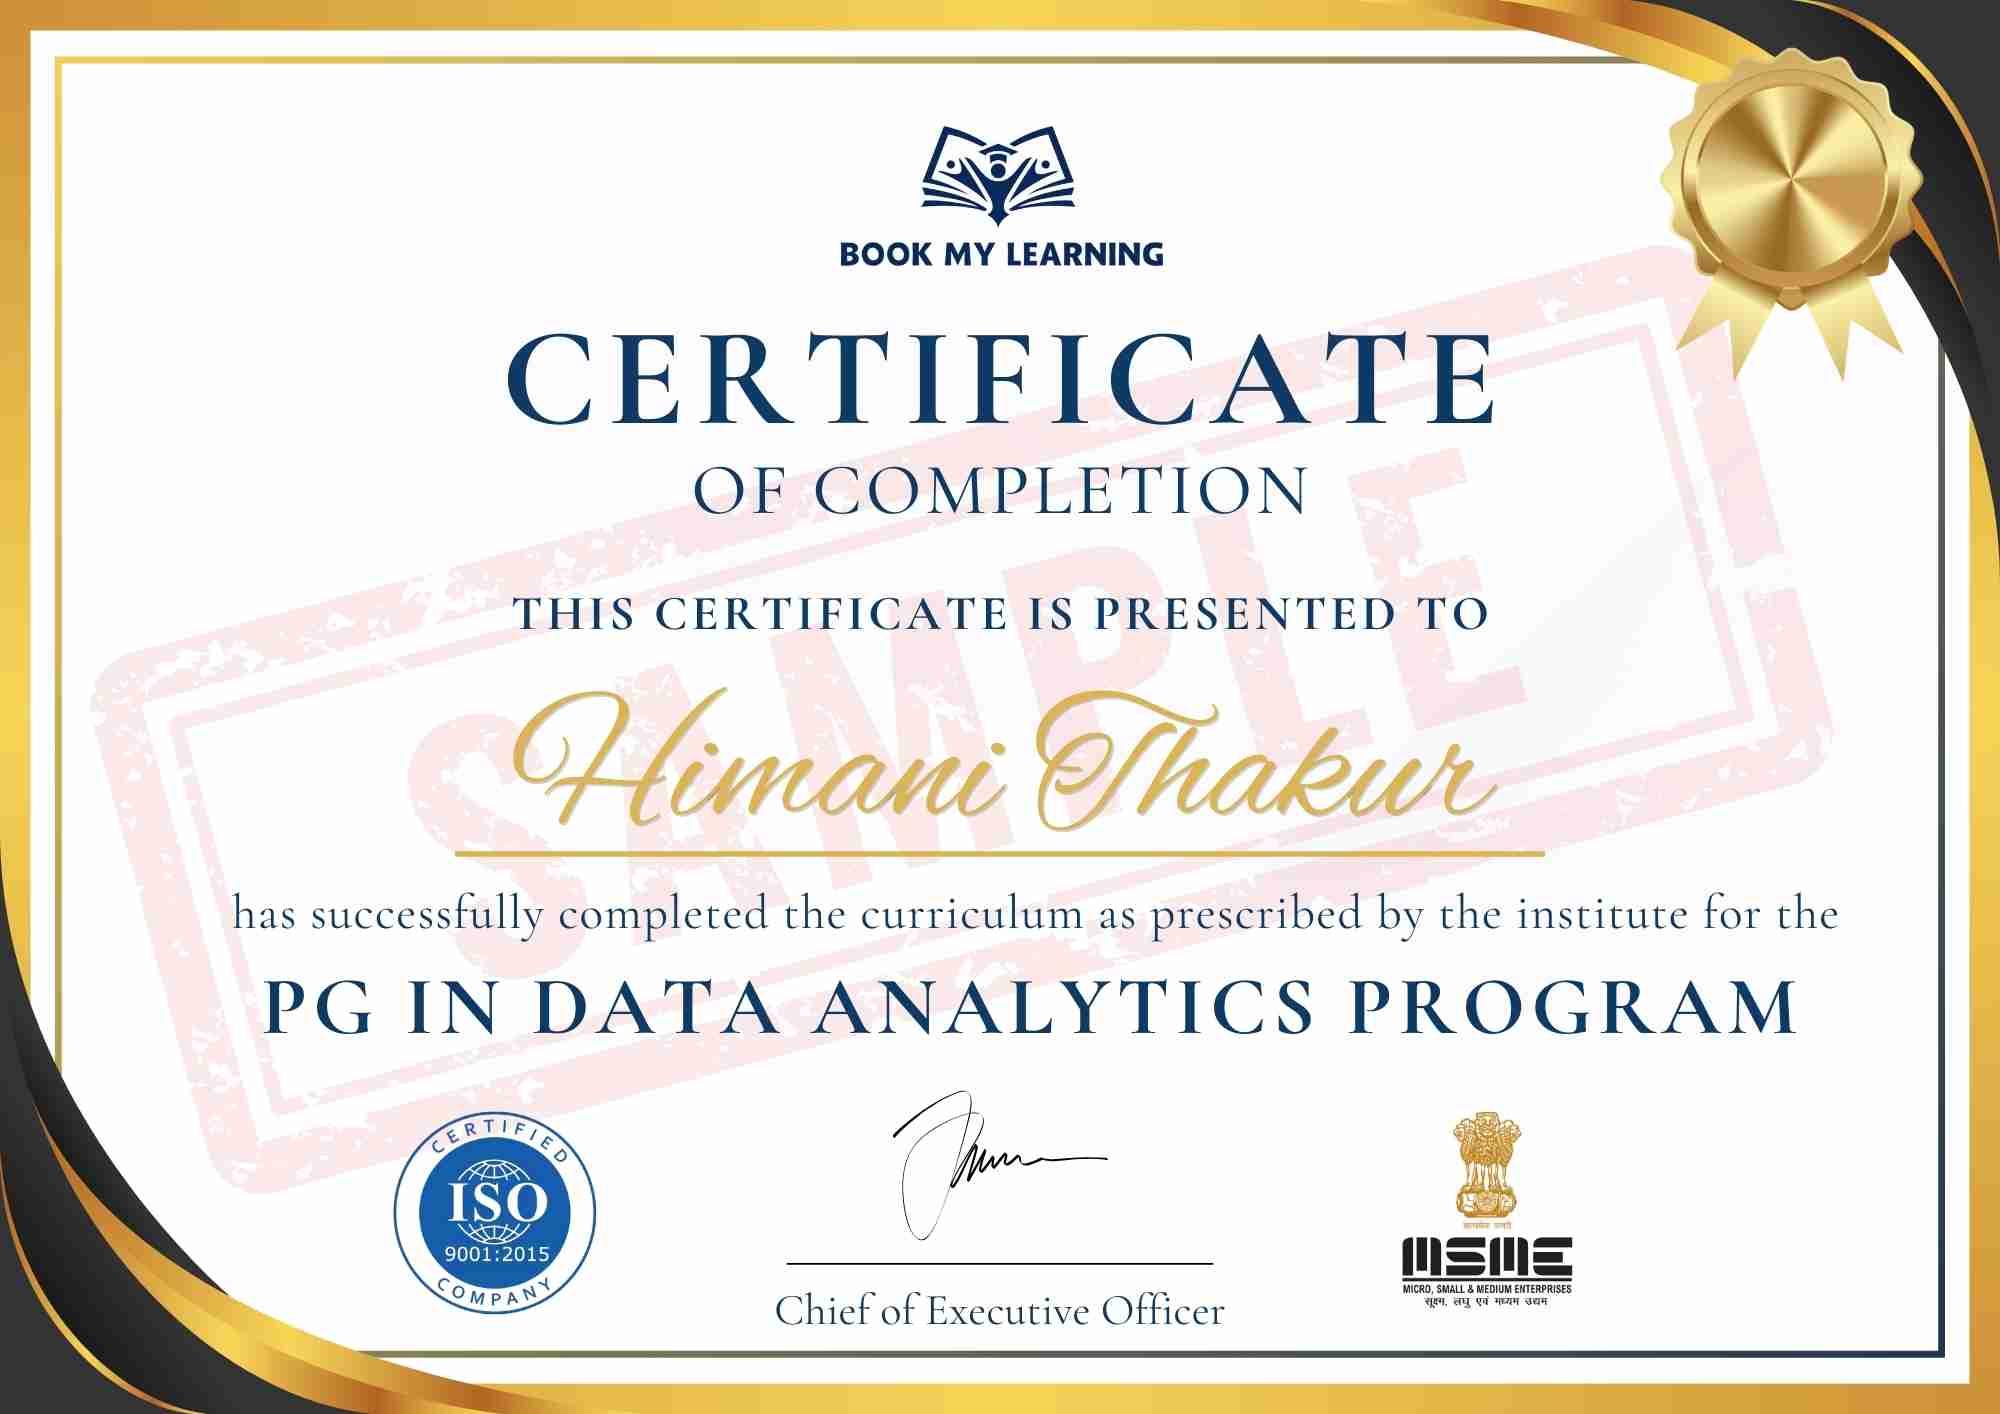
PG in Data Analytics
8 Months · Online
In collaboration with
-

PG Data Science with Cyber Security
10 Months · Online
In collaboration with
-

PG Program in Data Science with AI & ML
12 Months · Online
In collaboration with

-

PG Program in Investment Banking
10 Months · Online
In collaboration with
-

Certified Investment Banking Operations Professional
12 Months · Online
In collaboration with
-

Postgraduate Program in Banking & Finance
8 Months · Online
In collaboration with
-

Postgraduate Financial Analysis Program
9 Months · Online
In collaboration with